UNIBUI ANALYTICS
DELIVERABLES
UX strategy
User flows
Wireframes
User Experience
User Interface
ROLE
UX lead
Unibui is a marketplace where businesses can post promos/discounts to promote themselves to college students. Beside the student platform, we're also providing a business management tool to our business users to manage their promotions and get insights from the metrics (Know more about my process designing the Unibui and Unibui Business site).
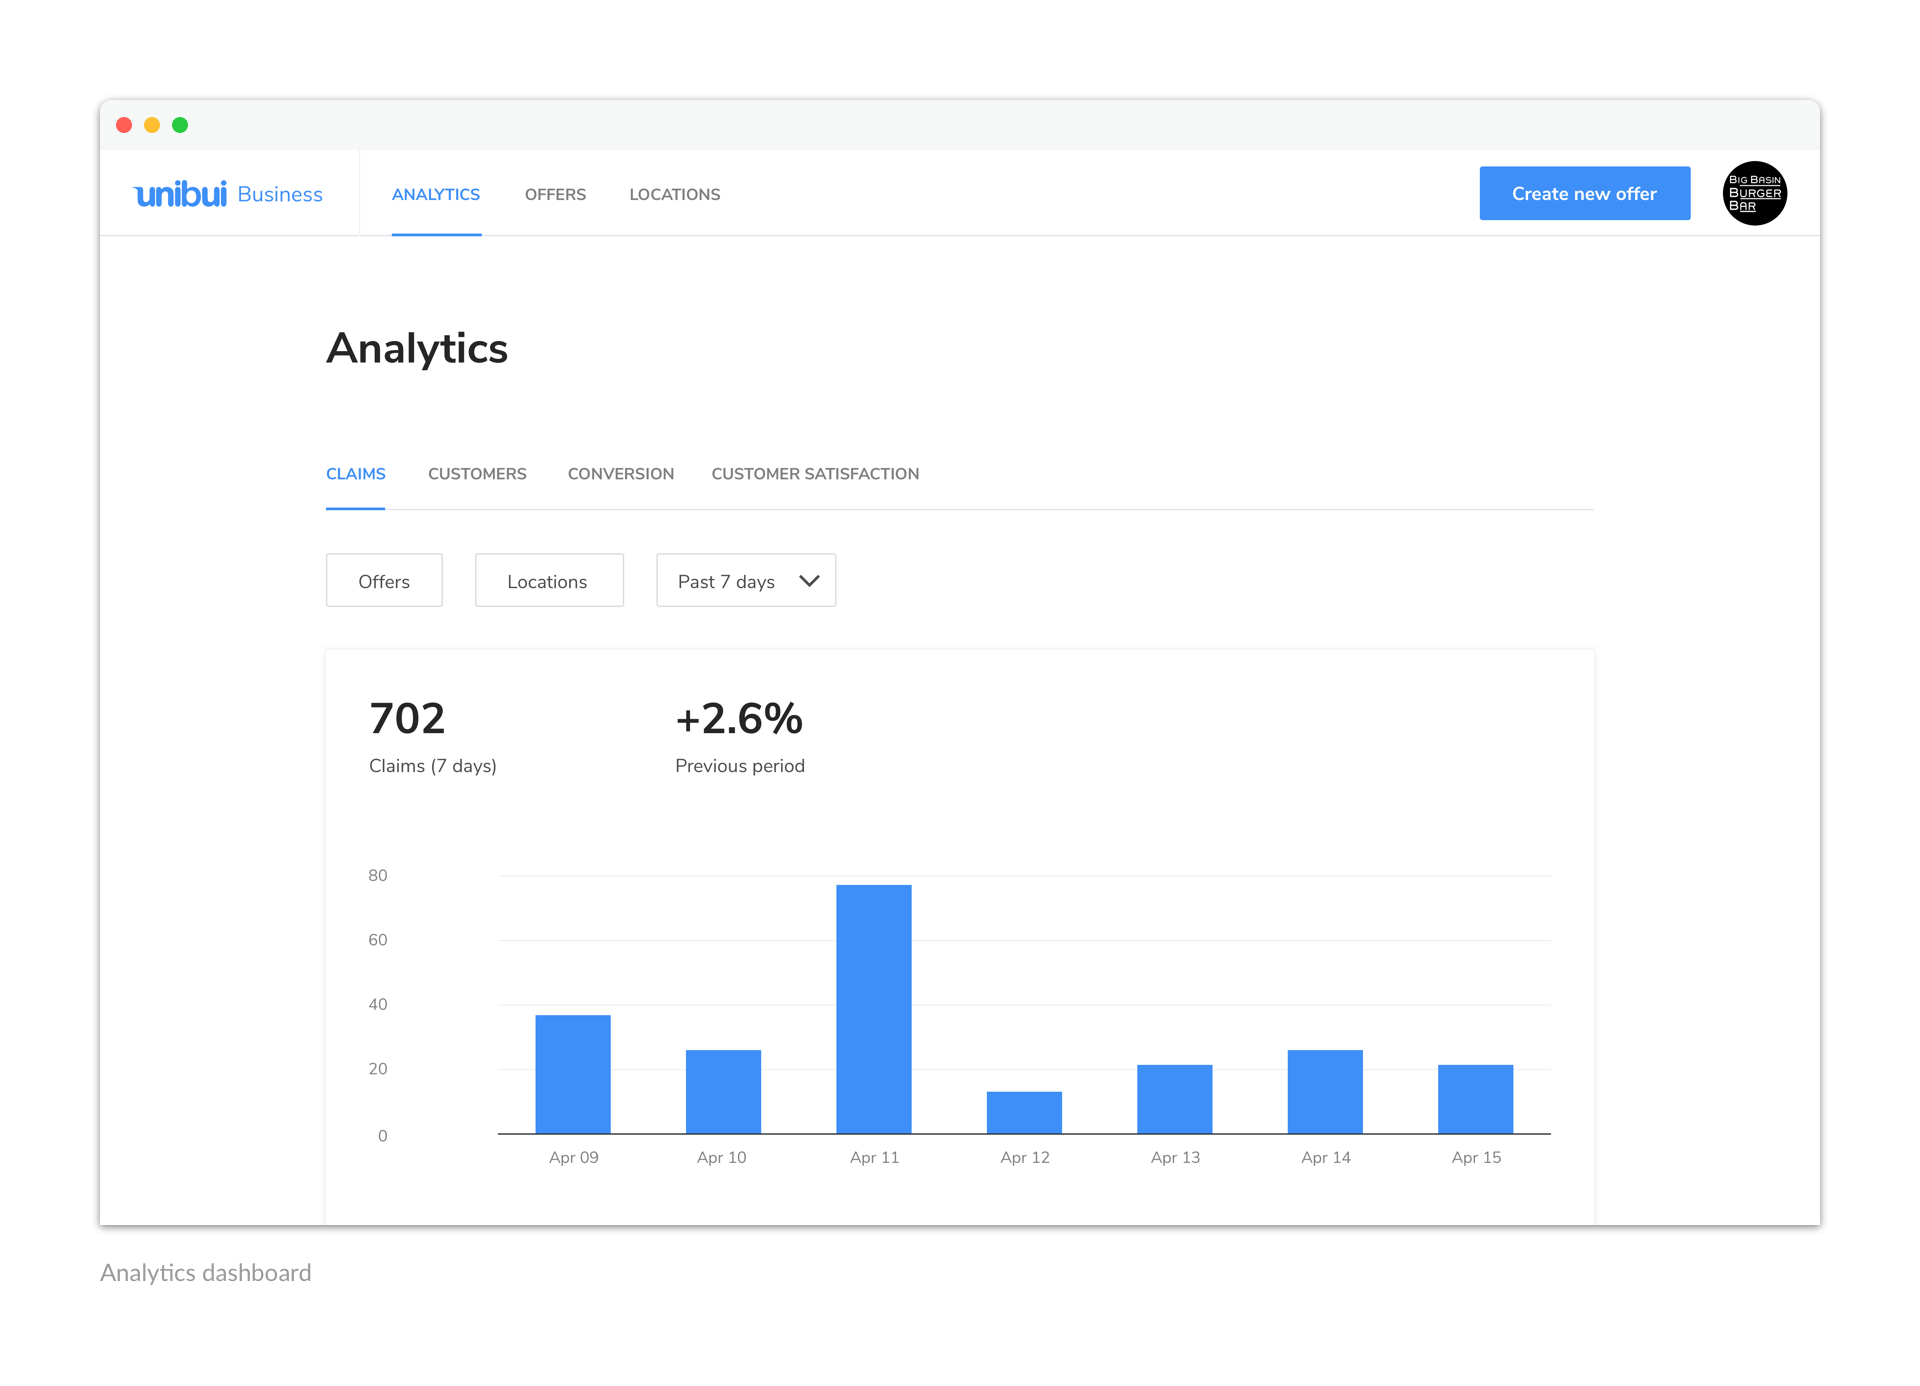
In order to show the metrics and the insights behind them, we designed an Analytics dashboard as a single section on the Unibui Business platform. We set it as the default view of the site to give our business users a quick glimpse of their business performance. The Analytics dashboard is a relative independent part of the site compared to other inter-twined features that form the whole management site. Its nature of being a "display tool" rather than a "management tool" also led to a different path of design. So I'll introduce how we designed the Analytics dashboard as well as the principles and guidelines we set for data visualization here after discussing our process of designing the whole business platfom in another post.
Perspectives to Show?
After speaking to our business users, we found our users do want some simpler, more synthesized perspectives on the raw data from us, rather than just giving them lines of raw data. Someone may doubt that in this way users would be influenced by our perspectives on the data and lose the possibility to discover more unique findings by themselves. However, the majority of our users chose to make that trade-off, and we did try compensating that by still providing the data behind the charts and numbers.
There're two types of base unit in our raw data: "An offer claim" and "A customer (student)". We can filter the number of claims or number of customers by one or more criteria (by time period, offer, location, customer age, gender, or college) to get some interesting results. For example, the college distribution of the number of customers who had claimed discount offers at a beer garden near Baxton College during the past 6 months may show that plenty of offer claimers are actually from another college 20 miles away. So that may be a good sign to open a second store.
However, there’re also some meaningless perspectives. For example, it makes no sense to filter the total number of customers by offers because a customer may claim different offers. After conducting thorough user research with our business users, we identified an initial set of core metrics: number of claims filtered by offer and location, number of customers filtered by their gender, age, and college, number of offer page visits, conversion rate, and offer ratings.
Once we decided the perspectives we thought are meaningful, we grouped the metrics into four major categories: claims, customers, conversion, and customer satisfaction.
Charts to Use?
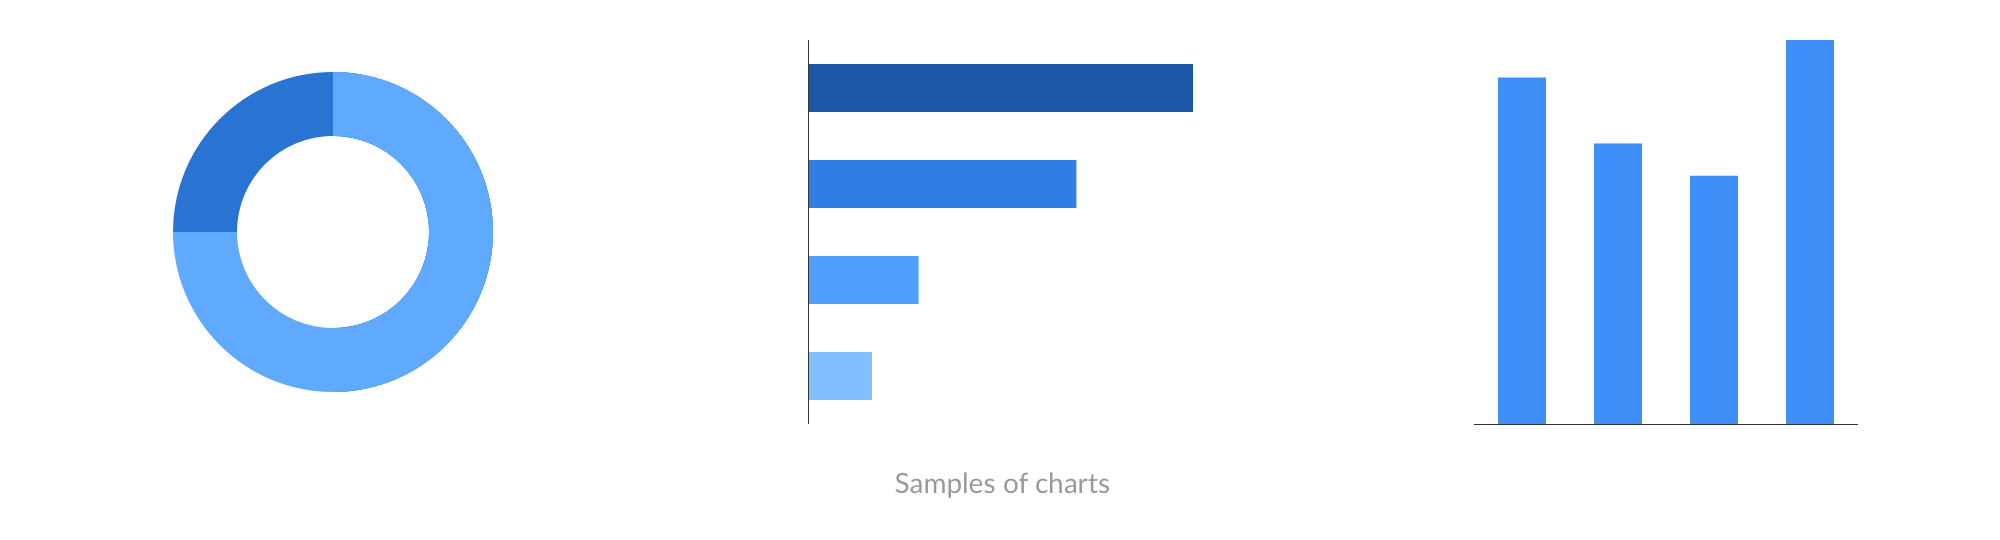
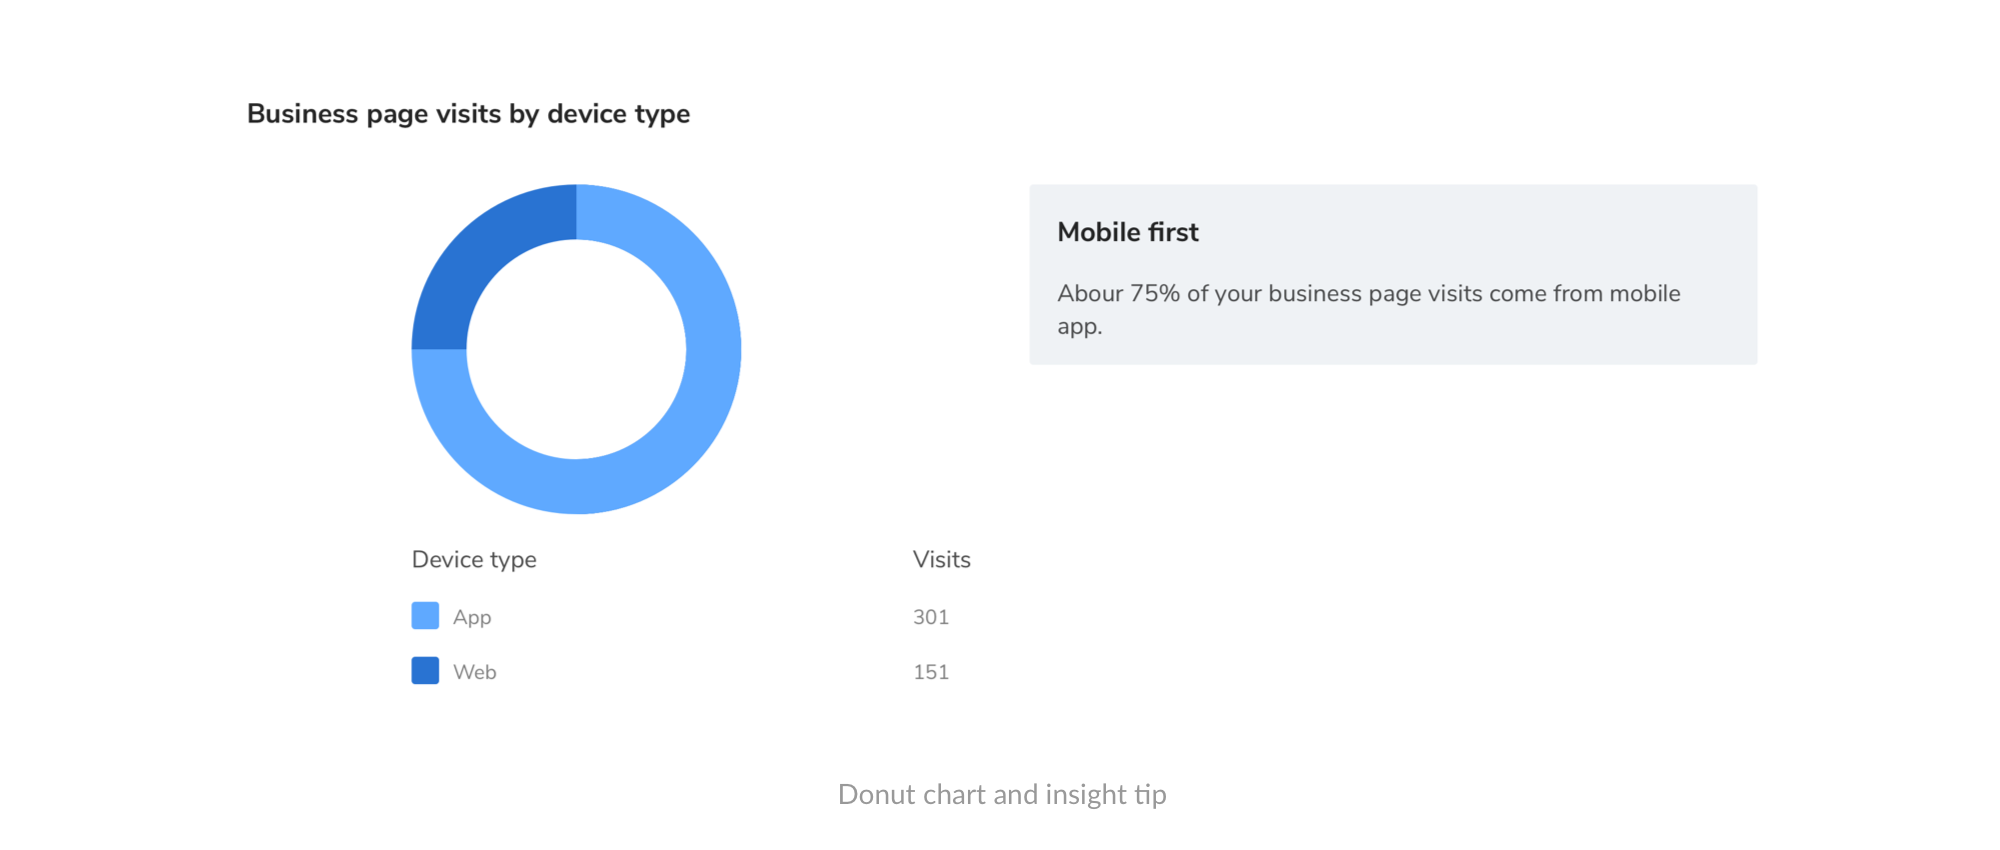
Based on the nature of our metrics, we chose bar chart and donut chart as our major ways of visualization. It’s suitable to use a donut chart when there’s a need to compare a certain part to the whole thing. In contrast, we use a bar chart when we want to emphasize how distributed parts are compared to each other.
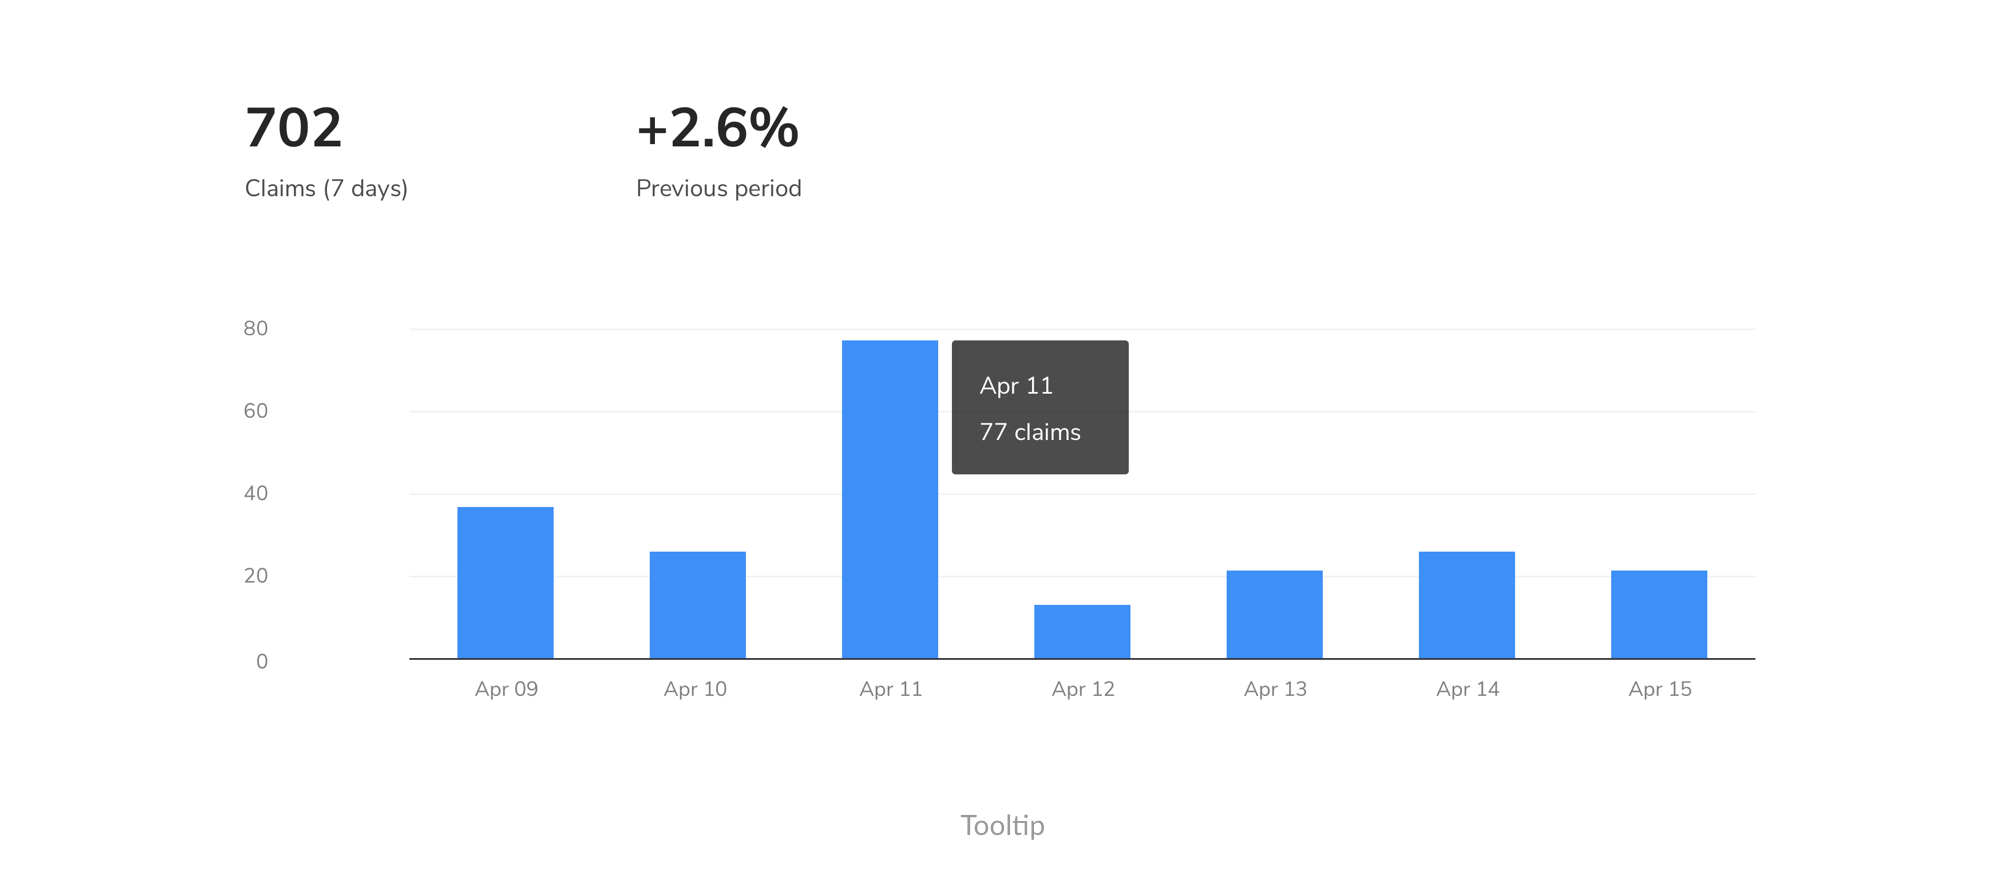
We use horizontal bar charts when the items are not inherently sequential to provide more space for item tags. But when the items are sequential, we use vertical bars. A common example of sequential items is dates, when we are showing trends of changes in the number of our customers.
Colors
It was an easy decision for us to use our Unibui Blue for monochromatic charts like a normal bar chart. However we can’t use our student site color palette for multi-color charts because there’re only 3 variants in the palette, which is not enough here. Also the variants are not differentiated enough from each other for that they have exact same hue and only differ in saturation and brightness in an HSV color model (Hue, Saturation, Brightness value). We did that on purpose when picking colors for student site to make the colors better fit each other, but lead to its incompetence when it comes to data visualization (although they are not picked for that purpose). So we have to pick some new colors.

As I mentioned before, we build our student site color palette with HSV color model. We thought the model is more understandable and operable compared to other color models, because the its dimensions that influences the final color are independent. So we were thinking about making the colors in our data visualization color palette vary in all 3 dimensions (rather than only 2) in order to get better differentiation

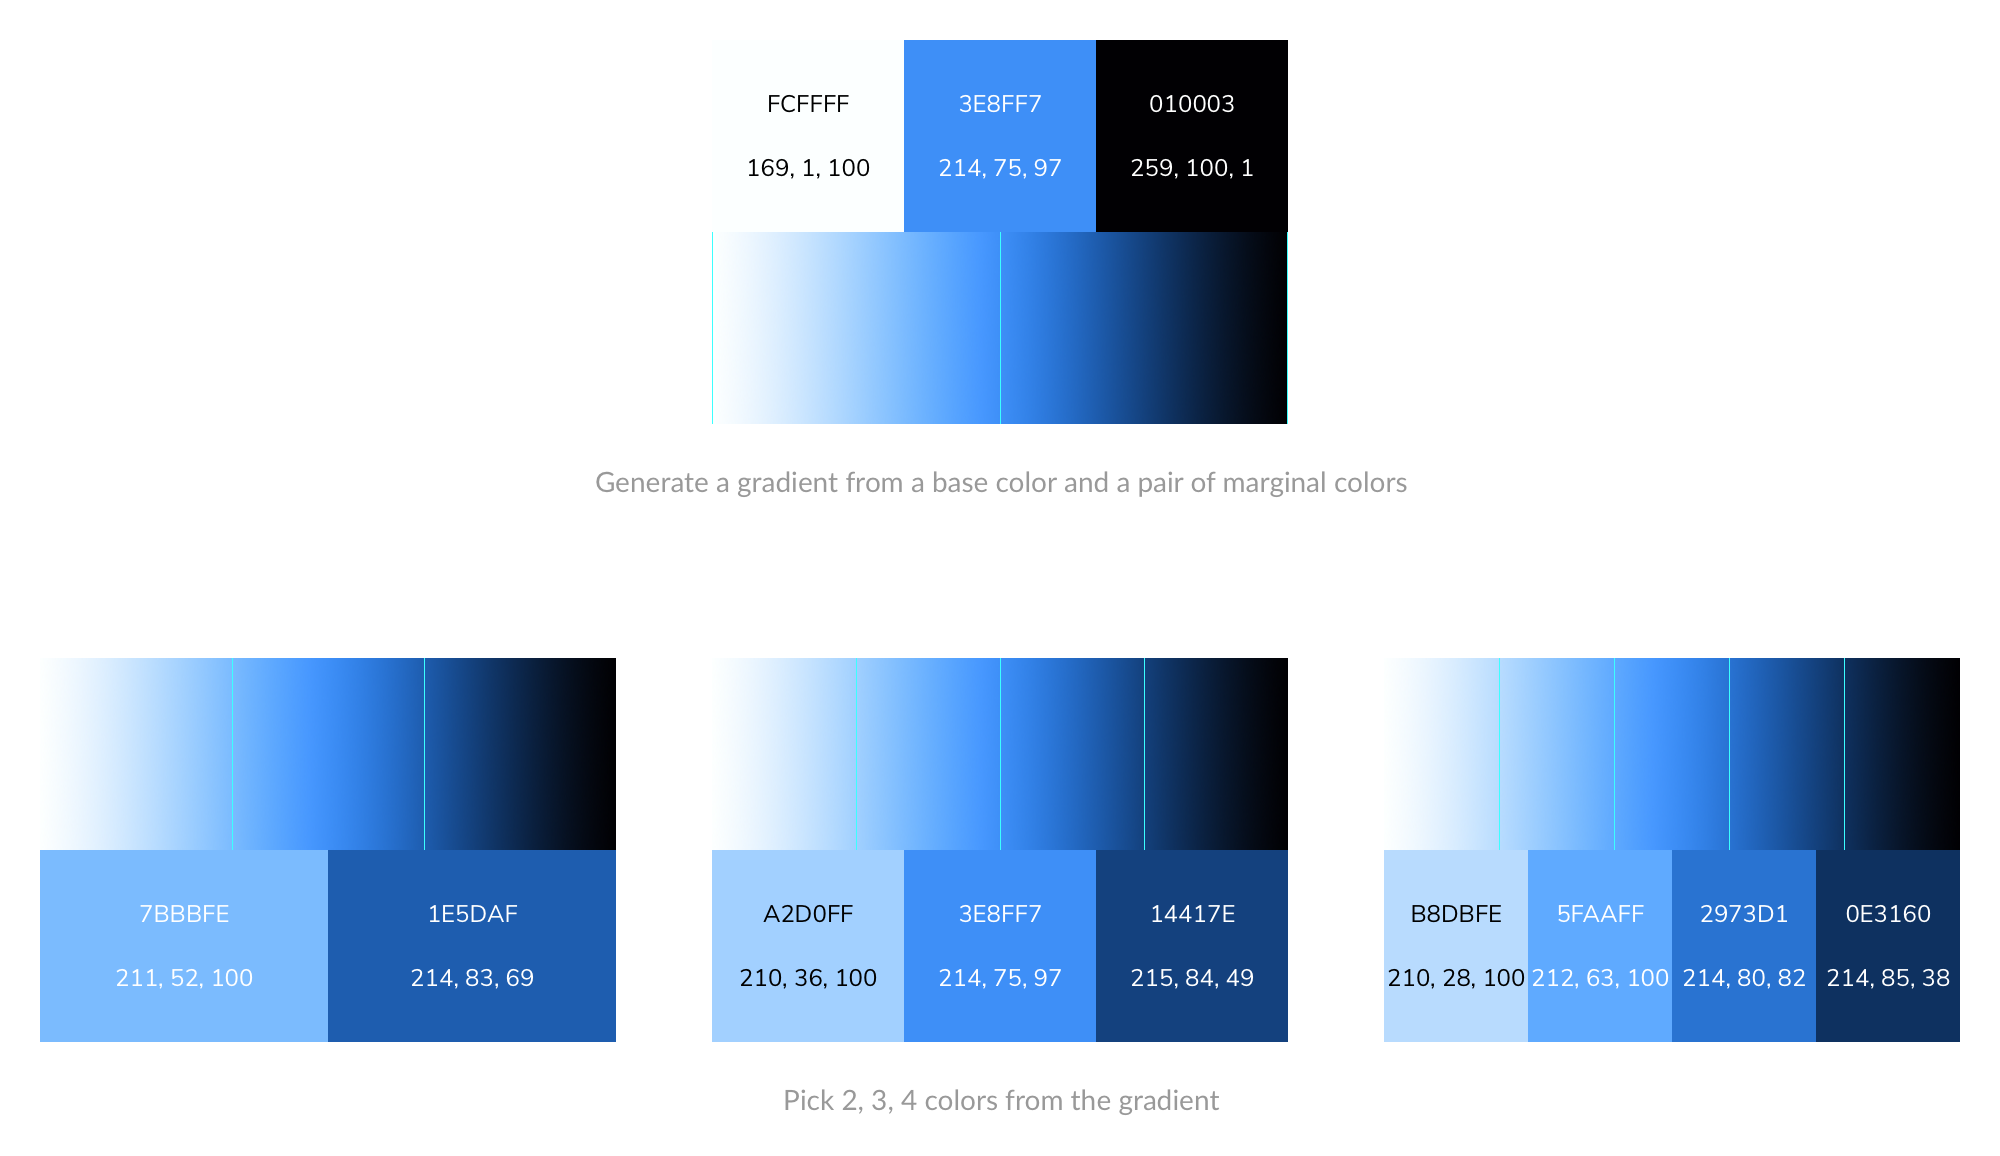
Next question is how many colors we want and how to decide the value of change in all three HSV dimensions from our base color, Unibui Blue. Thanks to a brilliant article I found on the Internet, we got the idea to generate a gradient from a base color and a pair of marginal colors. The saturation or brightness of the pair are set to its max value of 100 or min value of 1 in order to maximize the variantion of the gradient, while of hue values are set manually to deviate from the base color. Then we can pick the colors we need evenly from the gradient to form a palette. In this way, we managed to get a satisfying differentiation and keep the continuity at the same time.
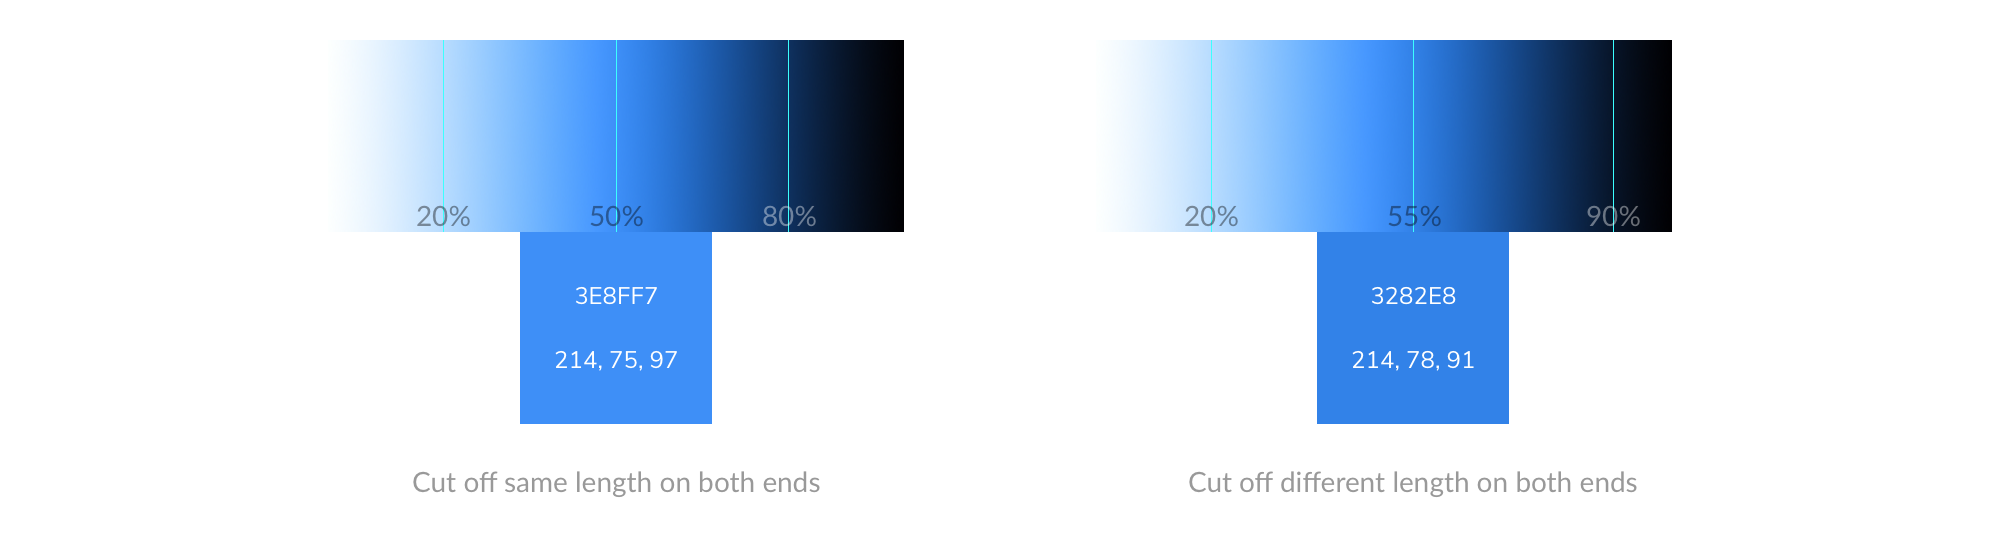
However there're still a few improvements we can make. Firstly, the parts near both ends in the gradient are not changing obviously as the rest parts due to the relative lower saturation or brightness. The solution is to cut off those parts and only use the central part of the gradient as our range for picking colors. Although the "light" end is wider than the "dark" end, we still decided to cut off the same length on both ends to keep our Unibui Blue stay at the geometrical mid-point of the range. By doing that, we made sure the Unibui Blue remains the base color of any color combination picked from this range, and the ONE color when we only need to pick one.
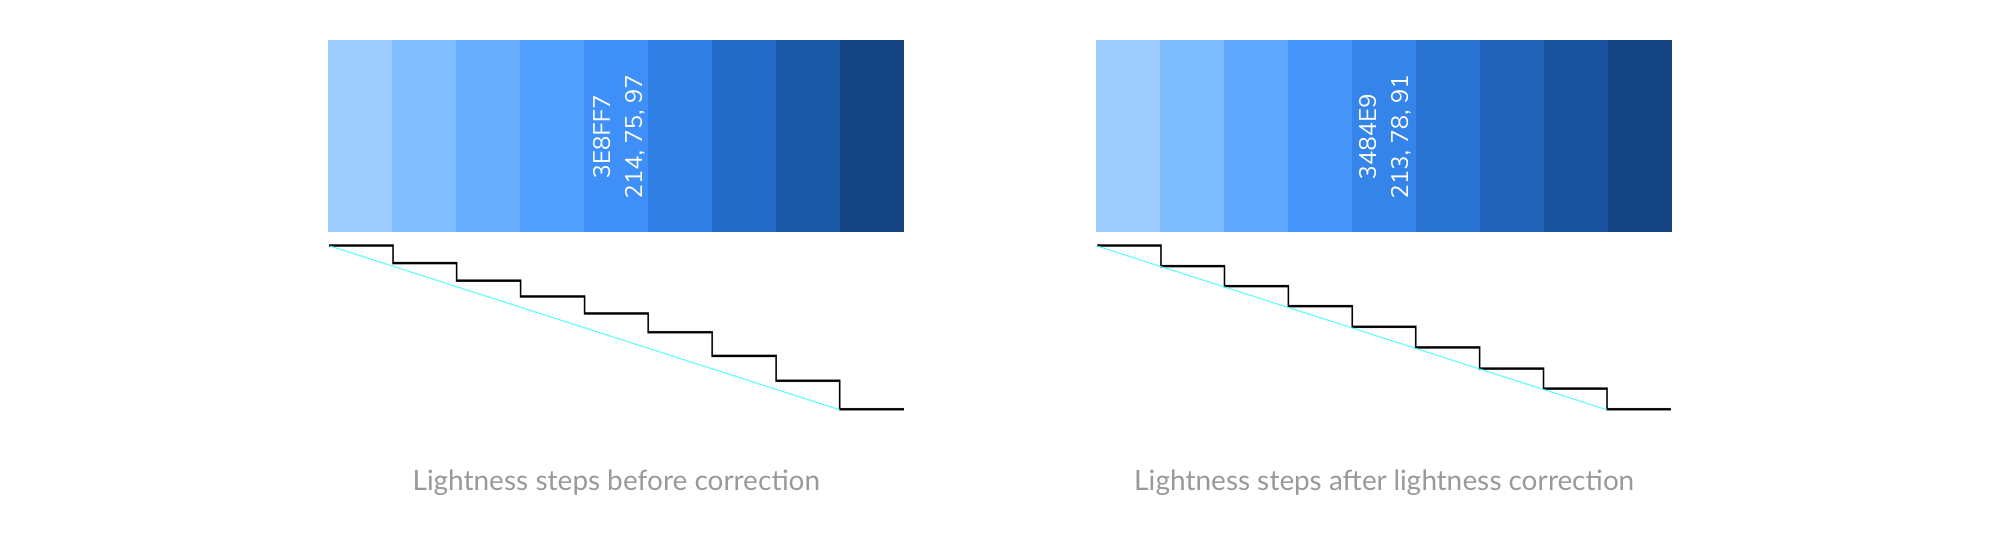
Other concerns about the palette include the uneven steps of the brightness change among the colors we pick. It is because the brightness of the gradient doesn't change linearly. We tested a few ways of mathmatical correction including Bezier interpolation and lightness correction and found those corrections would change the distribution of the picking points. Having our colors already differentiated enough from each other, we finally decided not to utilize any of these corrections on our palette in order to again keep Unibui Blue as the base color.
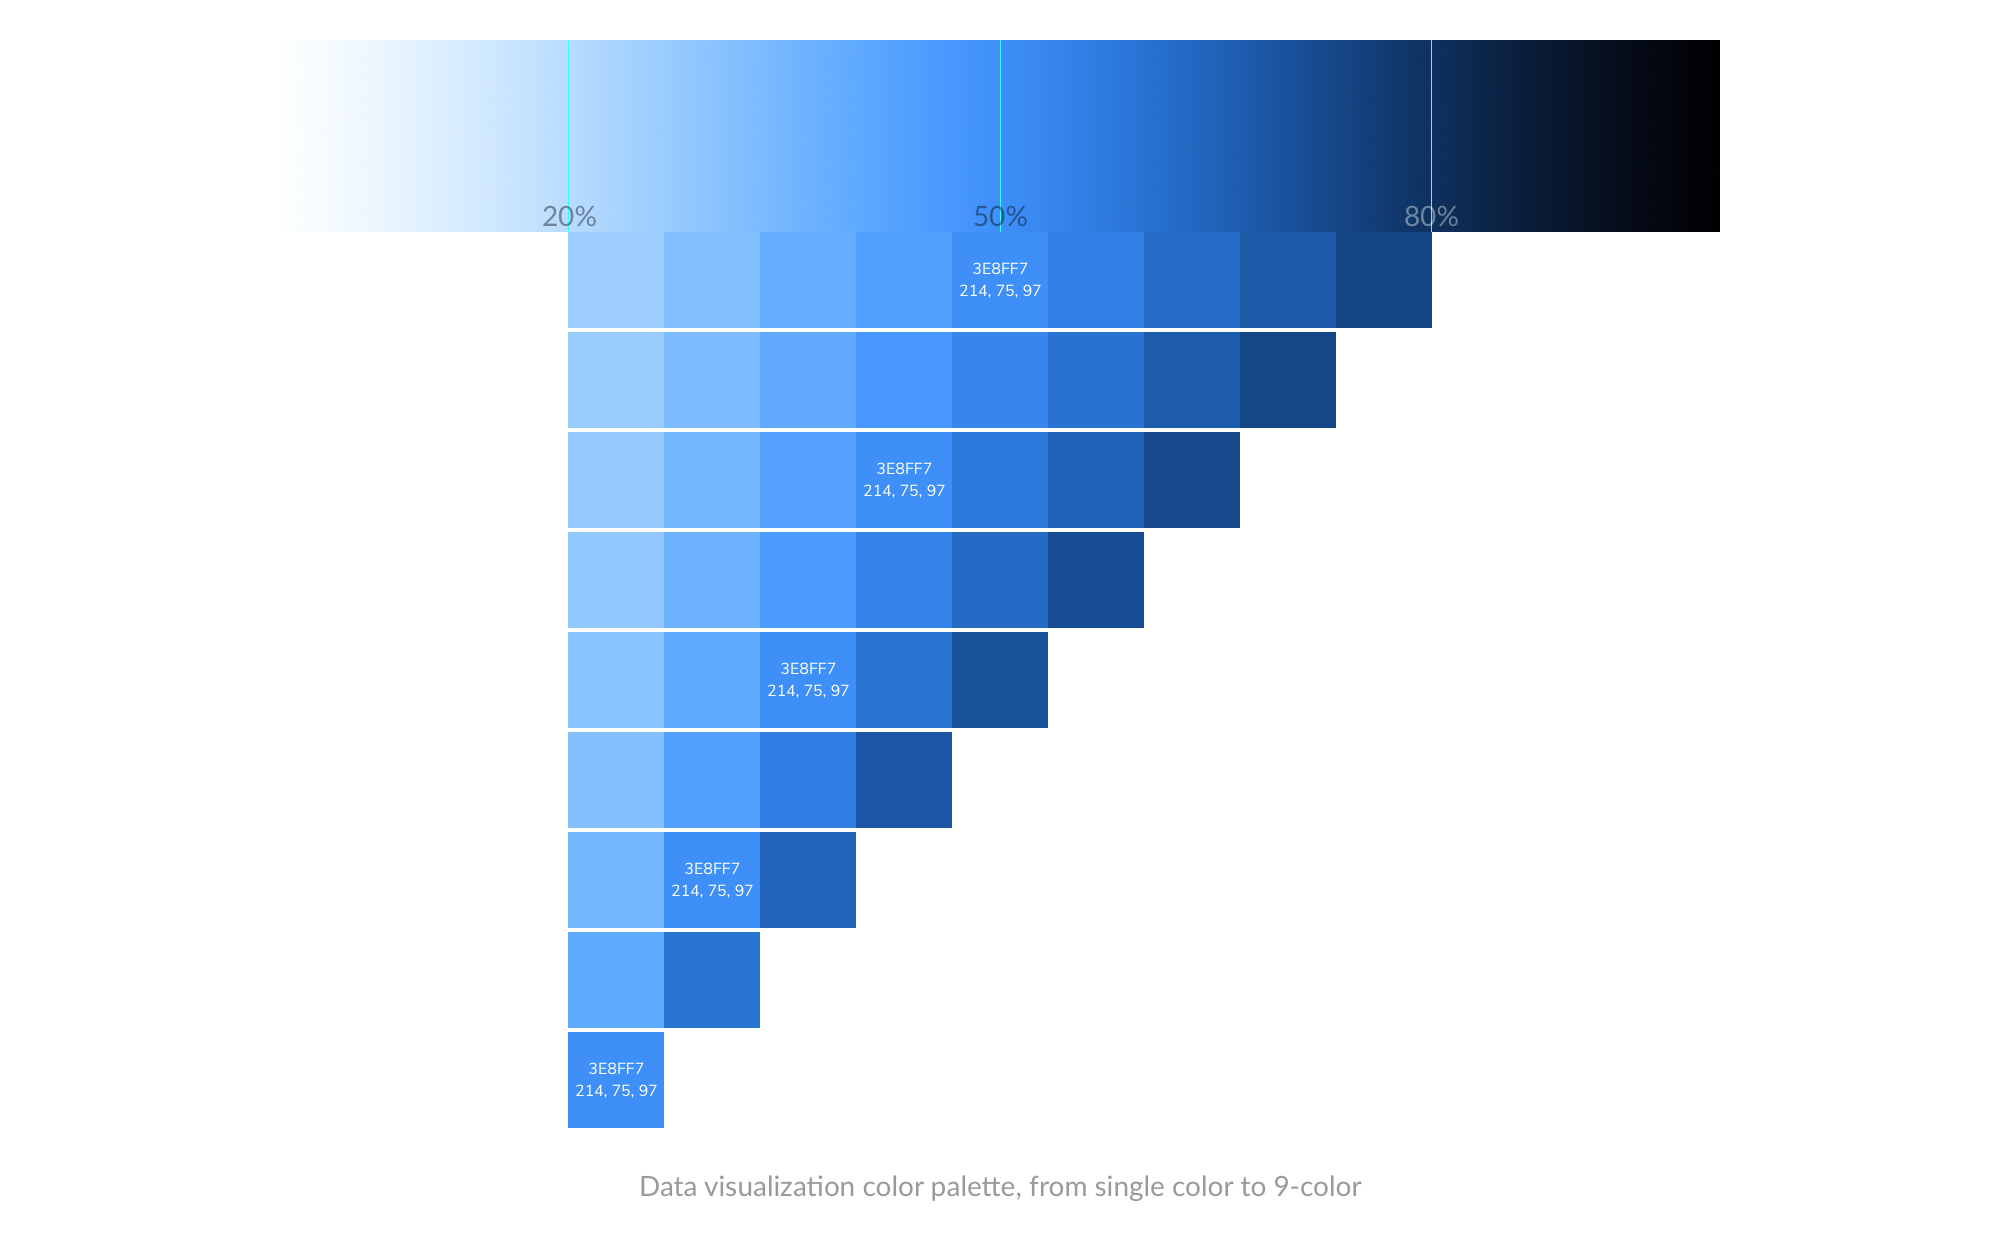
Here's the data visualization color palette we got for multi-color charts. We took the part in the middle of the gradient and picked different numbers of colors to form the color combinations for different occasions from one single color to 9 colors. So we can directly choose the right combination when we try to fill a multi-color chart like a 5-section donut chart. The good thing about the gradient is its flexibilty, which allows us to pick new colors from it when there's need for more than 9 colors. We can even generate more sets of color palettes easily based on our secondary colors like red and green through this process.
Insights
With the Analytics dashboard, our business users can gain insight from the metrics and charts. Moreover, we put textual tips alongside charts to make the point even clearer and further simplify users’ cognitive path. The solution is simple: we analyze the data from the chart and use understandable words to speak it out. We may provide more practical suggestions on their future businesses once we have more advanced analysis methods.
Tooltips
We enable tooltips when columns in charts are on hover, in order to show extra information when necessary.
The Dashboard
With all these chart types, colors, and perspectives to show in mind, we finally built the Analytics dashboard:
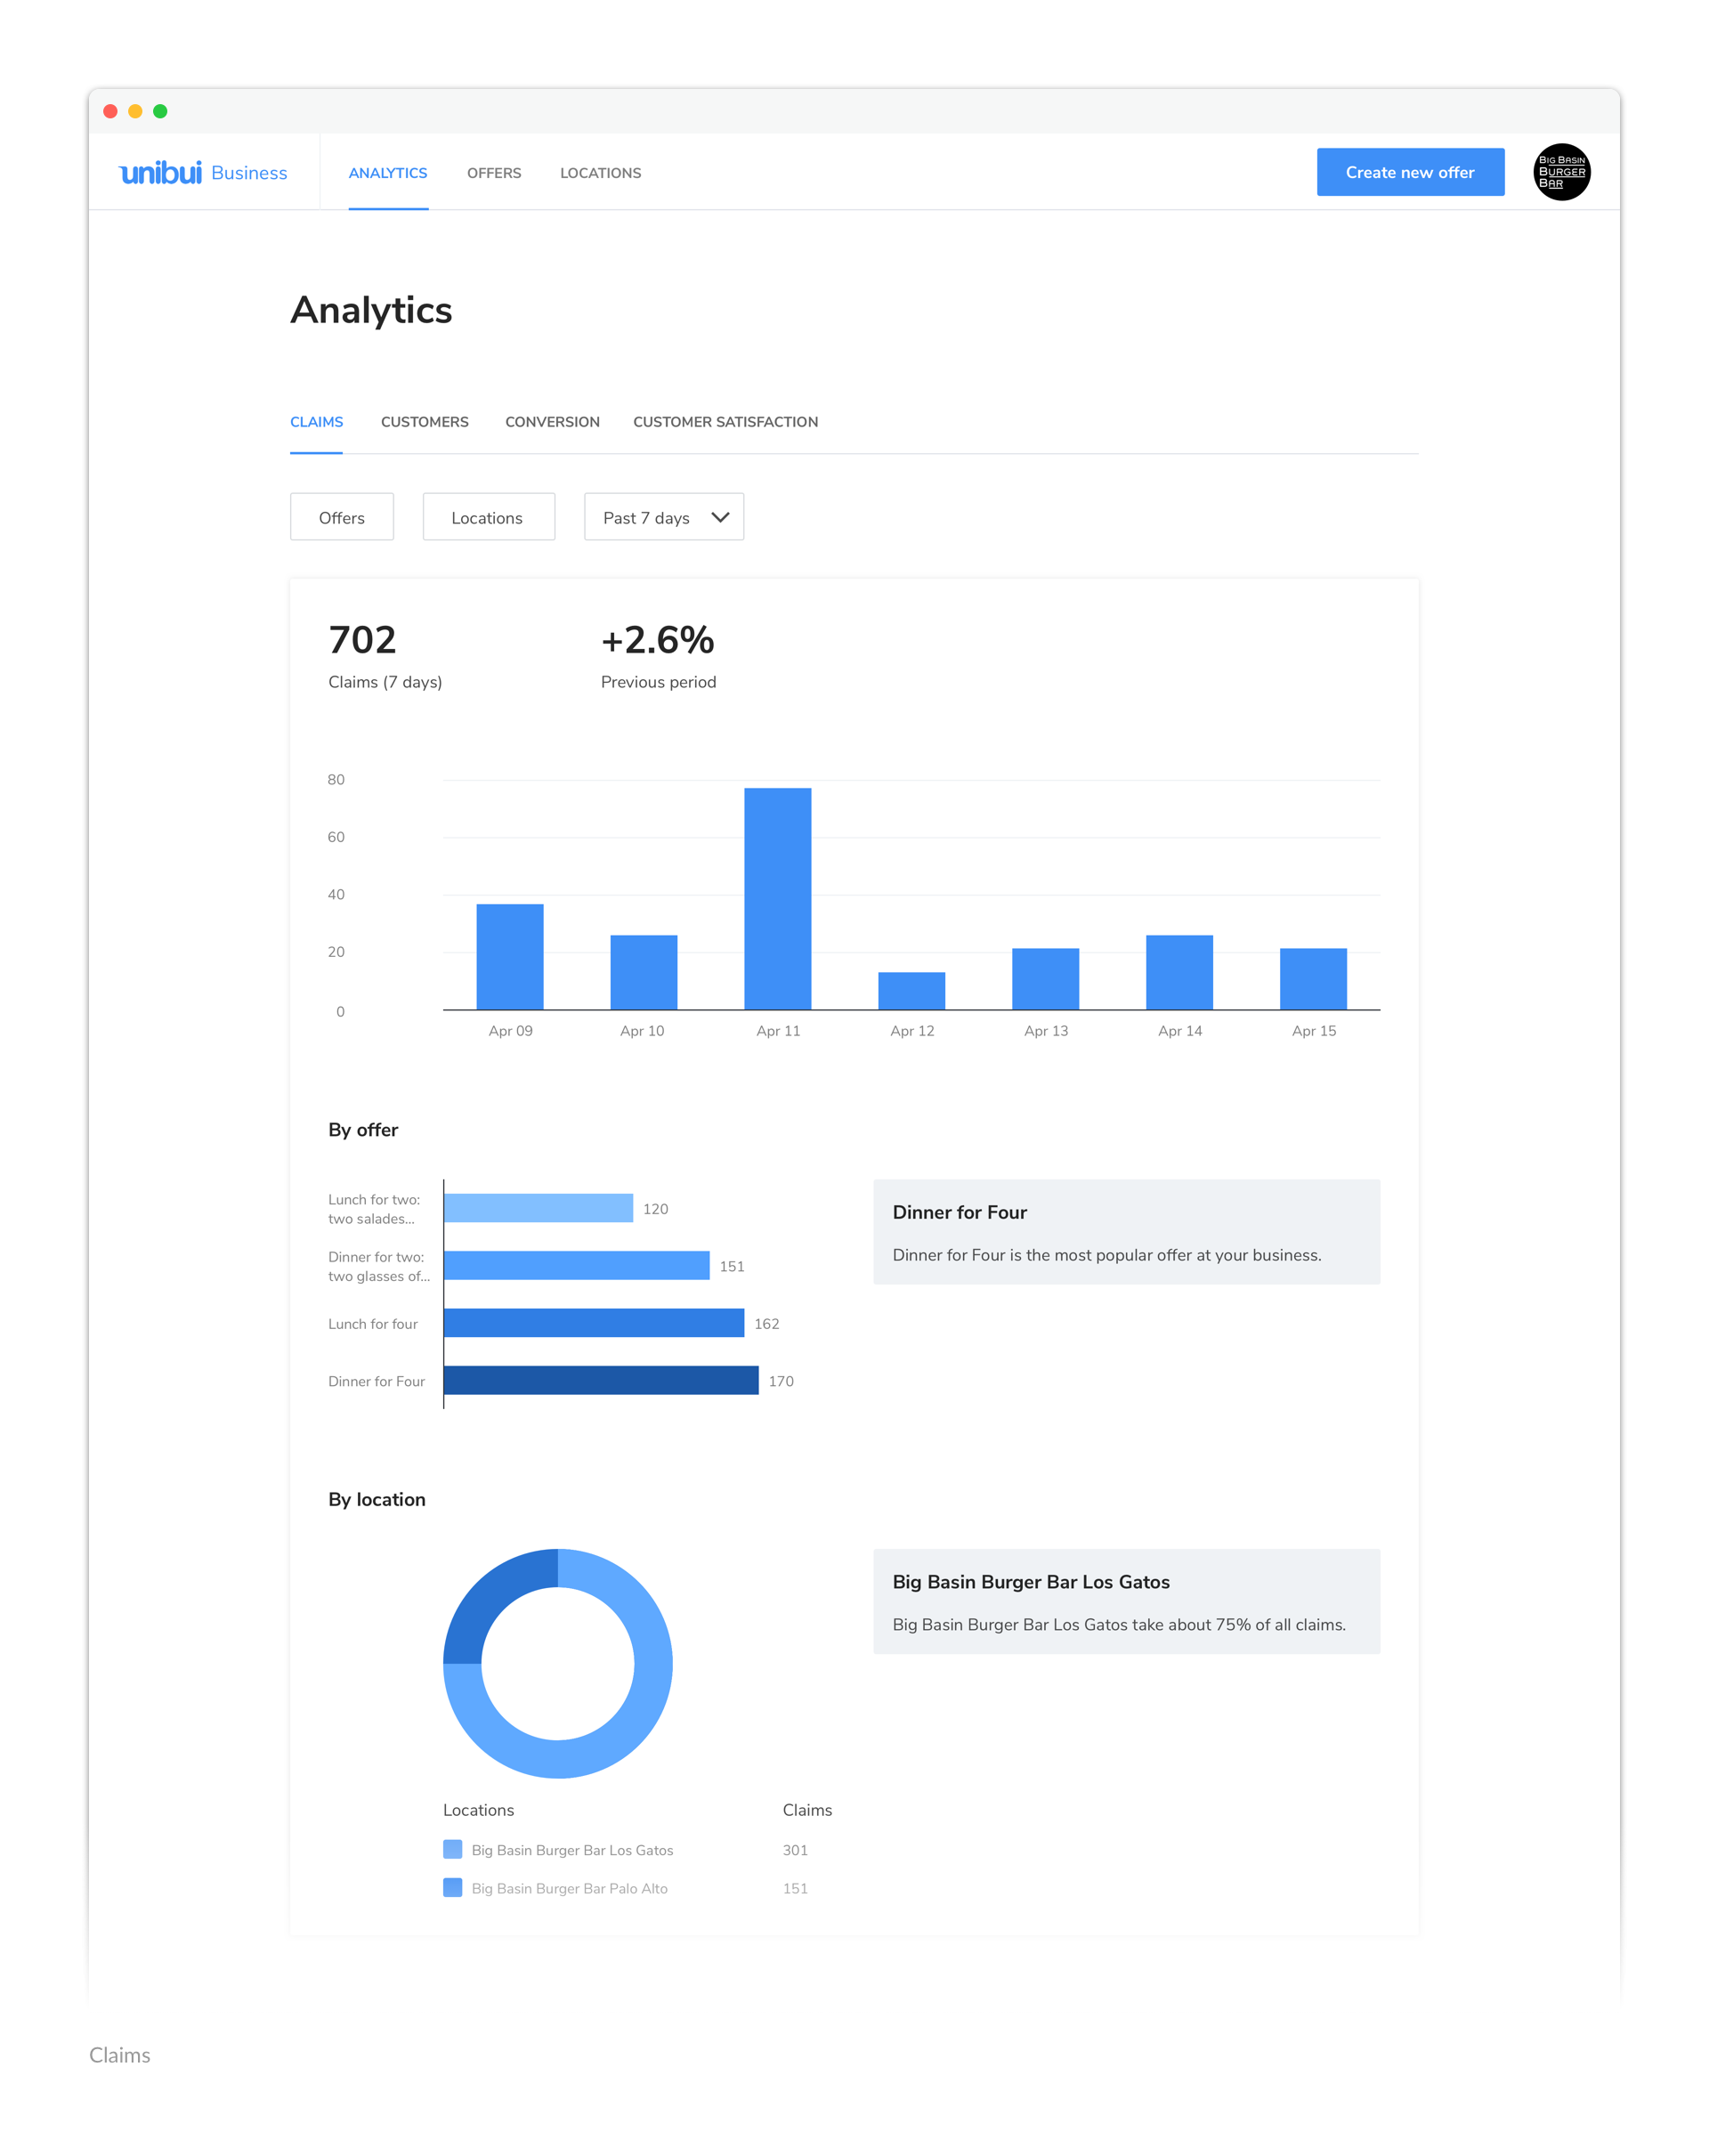
On our Claims section, we provide a window into how businesses are performing in terms of their offer claims. Metrics like claims trends, claims by different offers and locations are useful information for business owners when planning menus and determining marketing strategy.
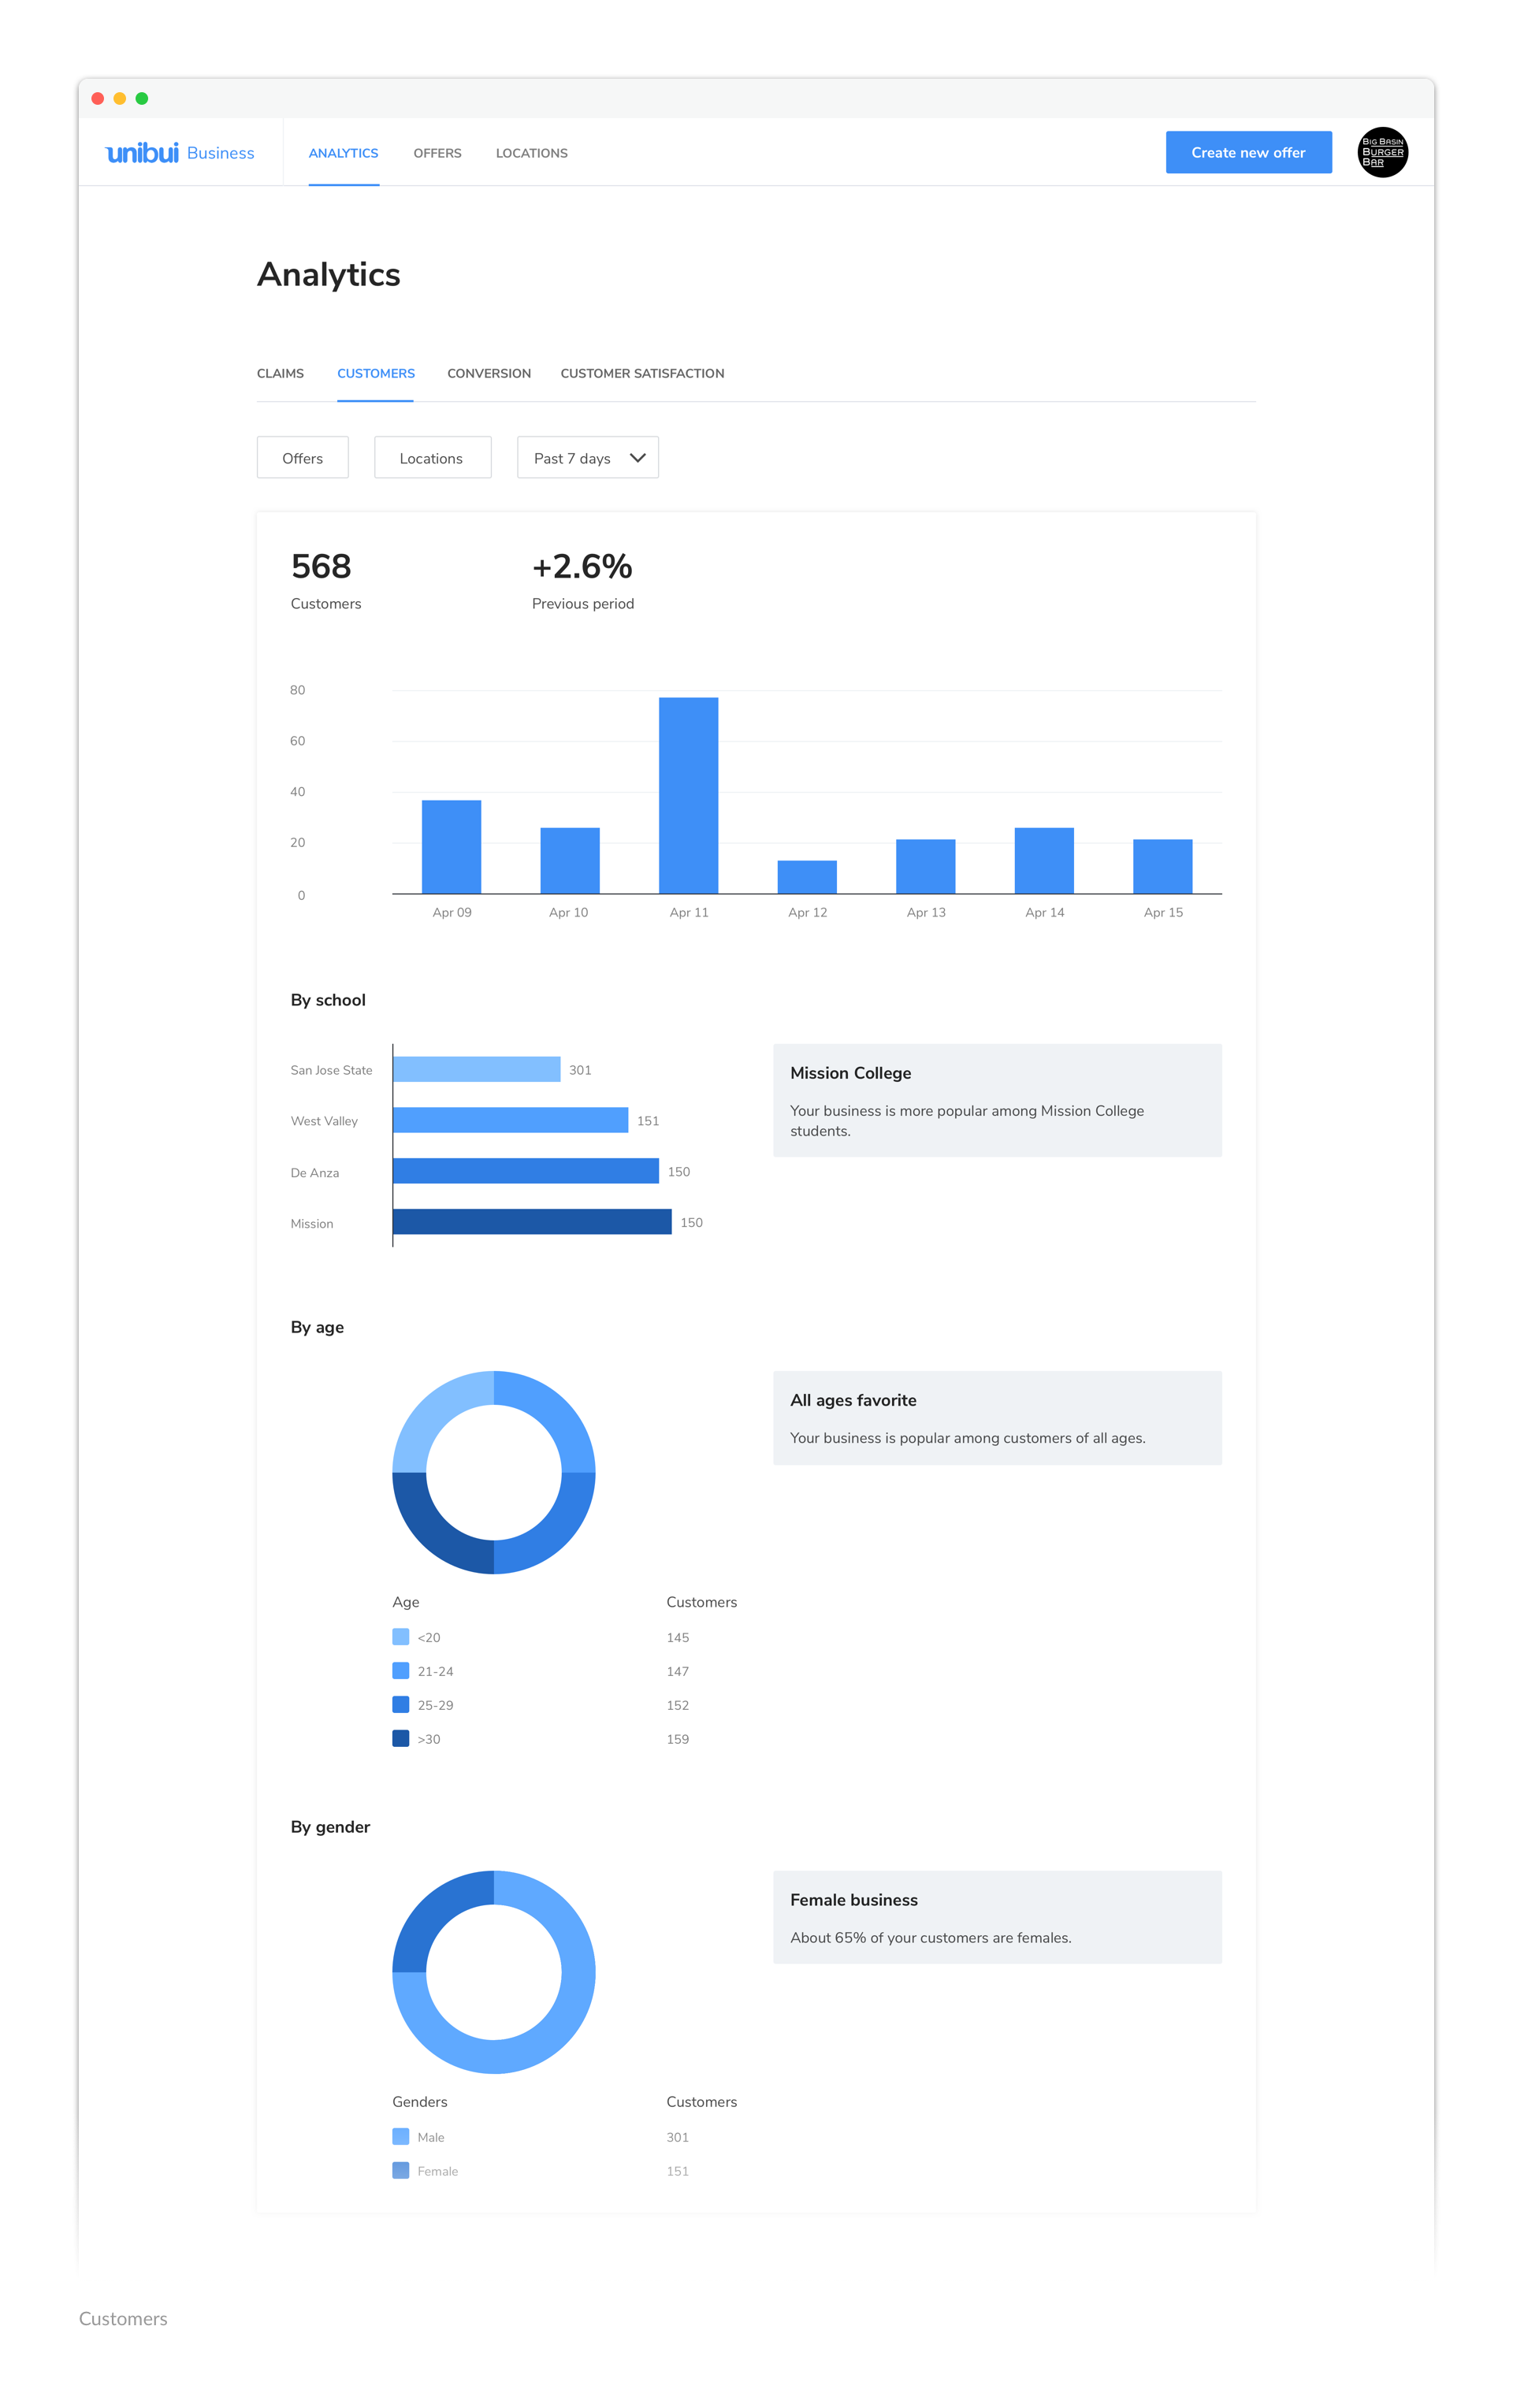
On our Customers section, we show business owners how demographic factors like customer age, gender, and which school they are from are related to their claims. By providing this data, we can help our business owners better focus on their target customers.
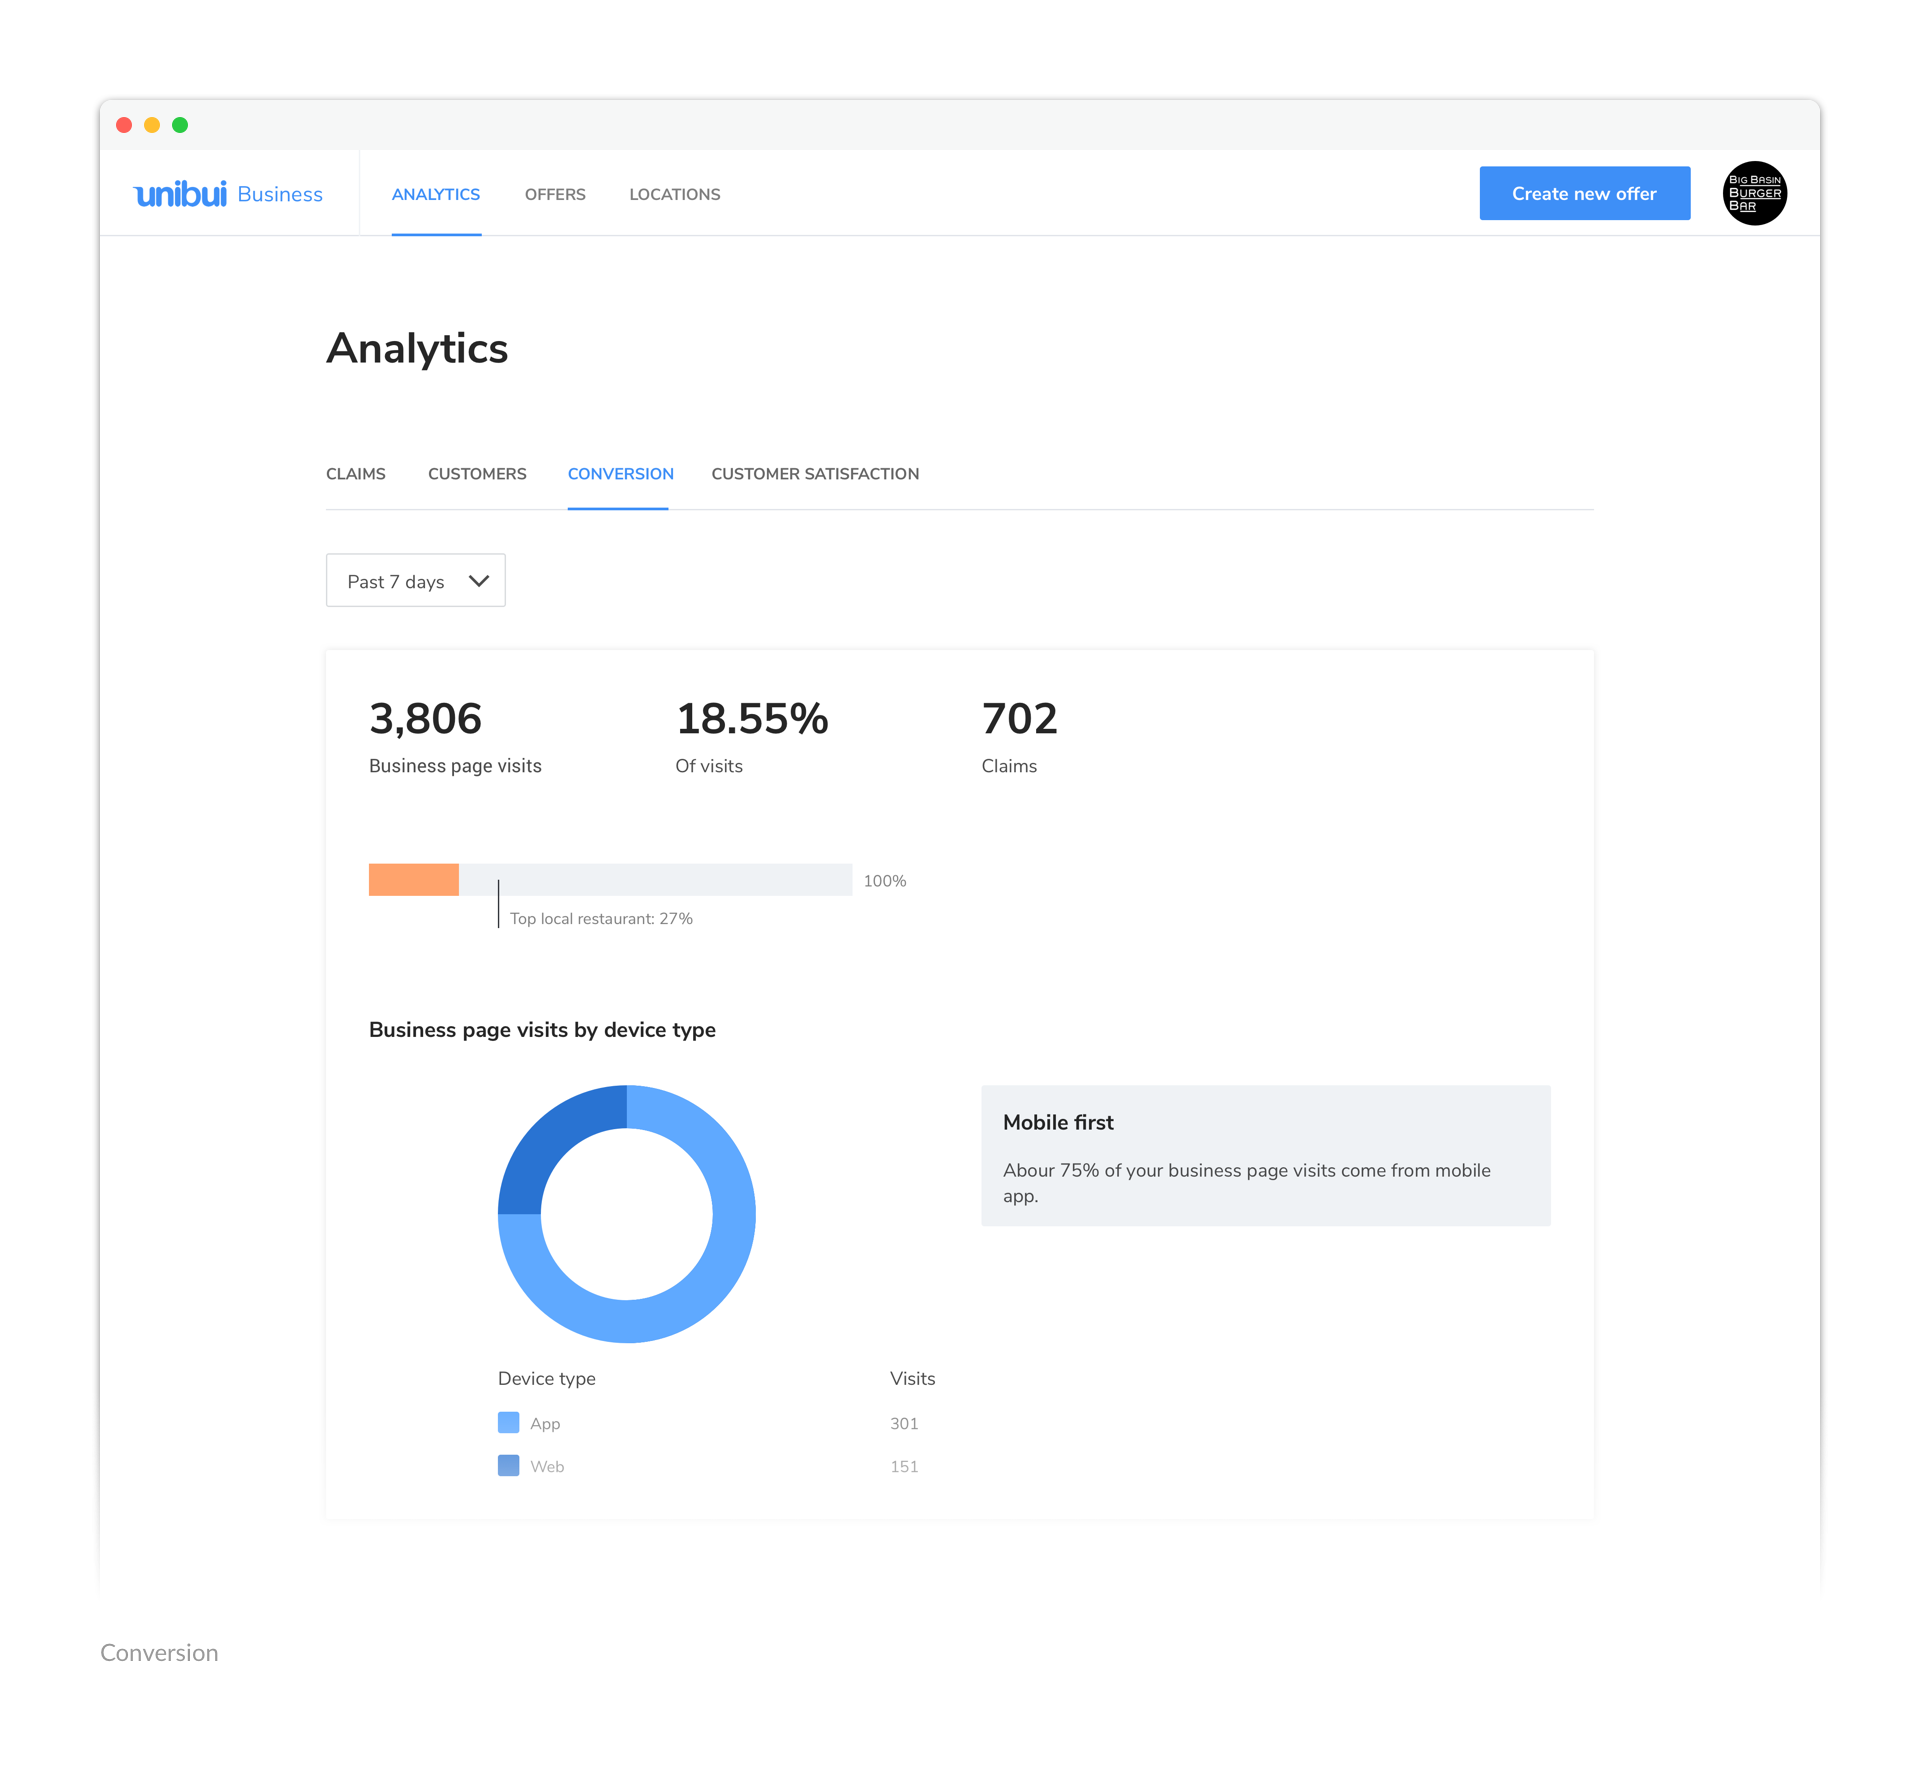
On our Conversion section, we tell business owners how many times their page has been visited and how many of them have been converted into actual claims. We also compare their conversion rates with top local businesses of the same business category to inform them how they perform among their local peers.
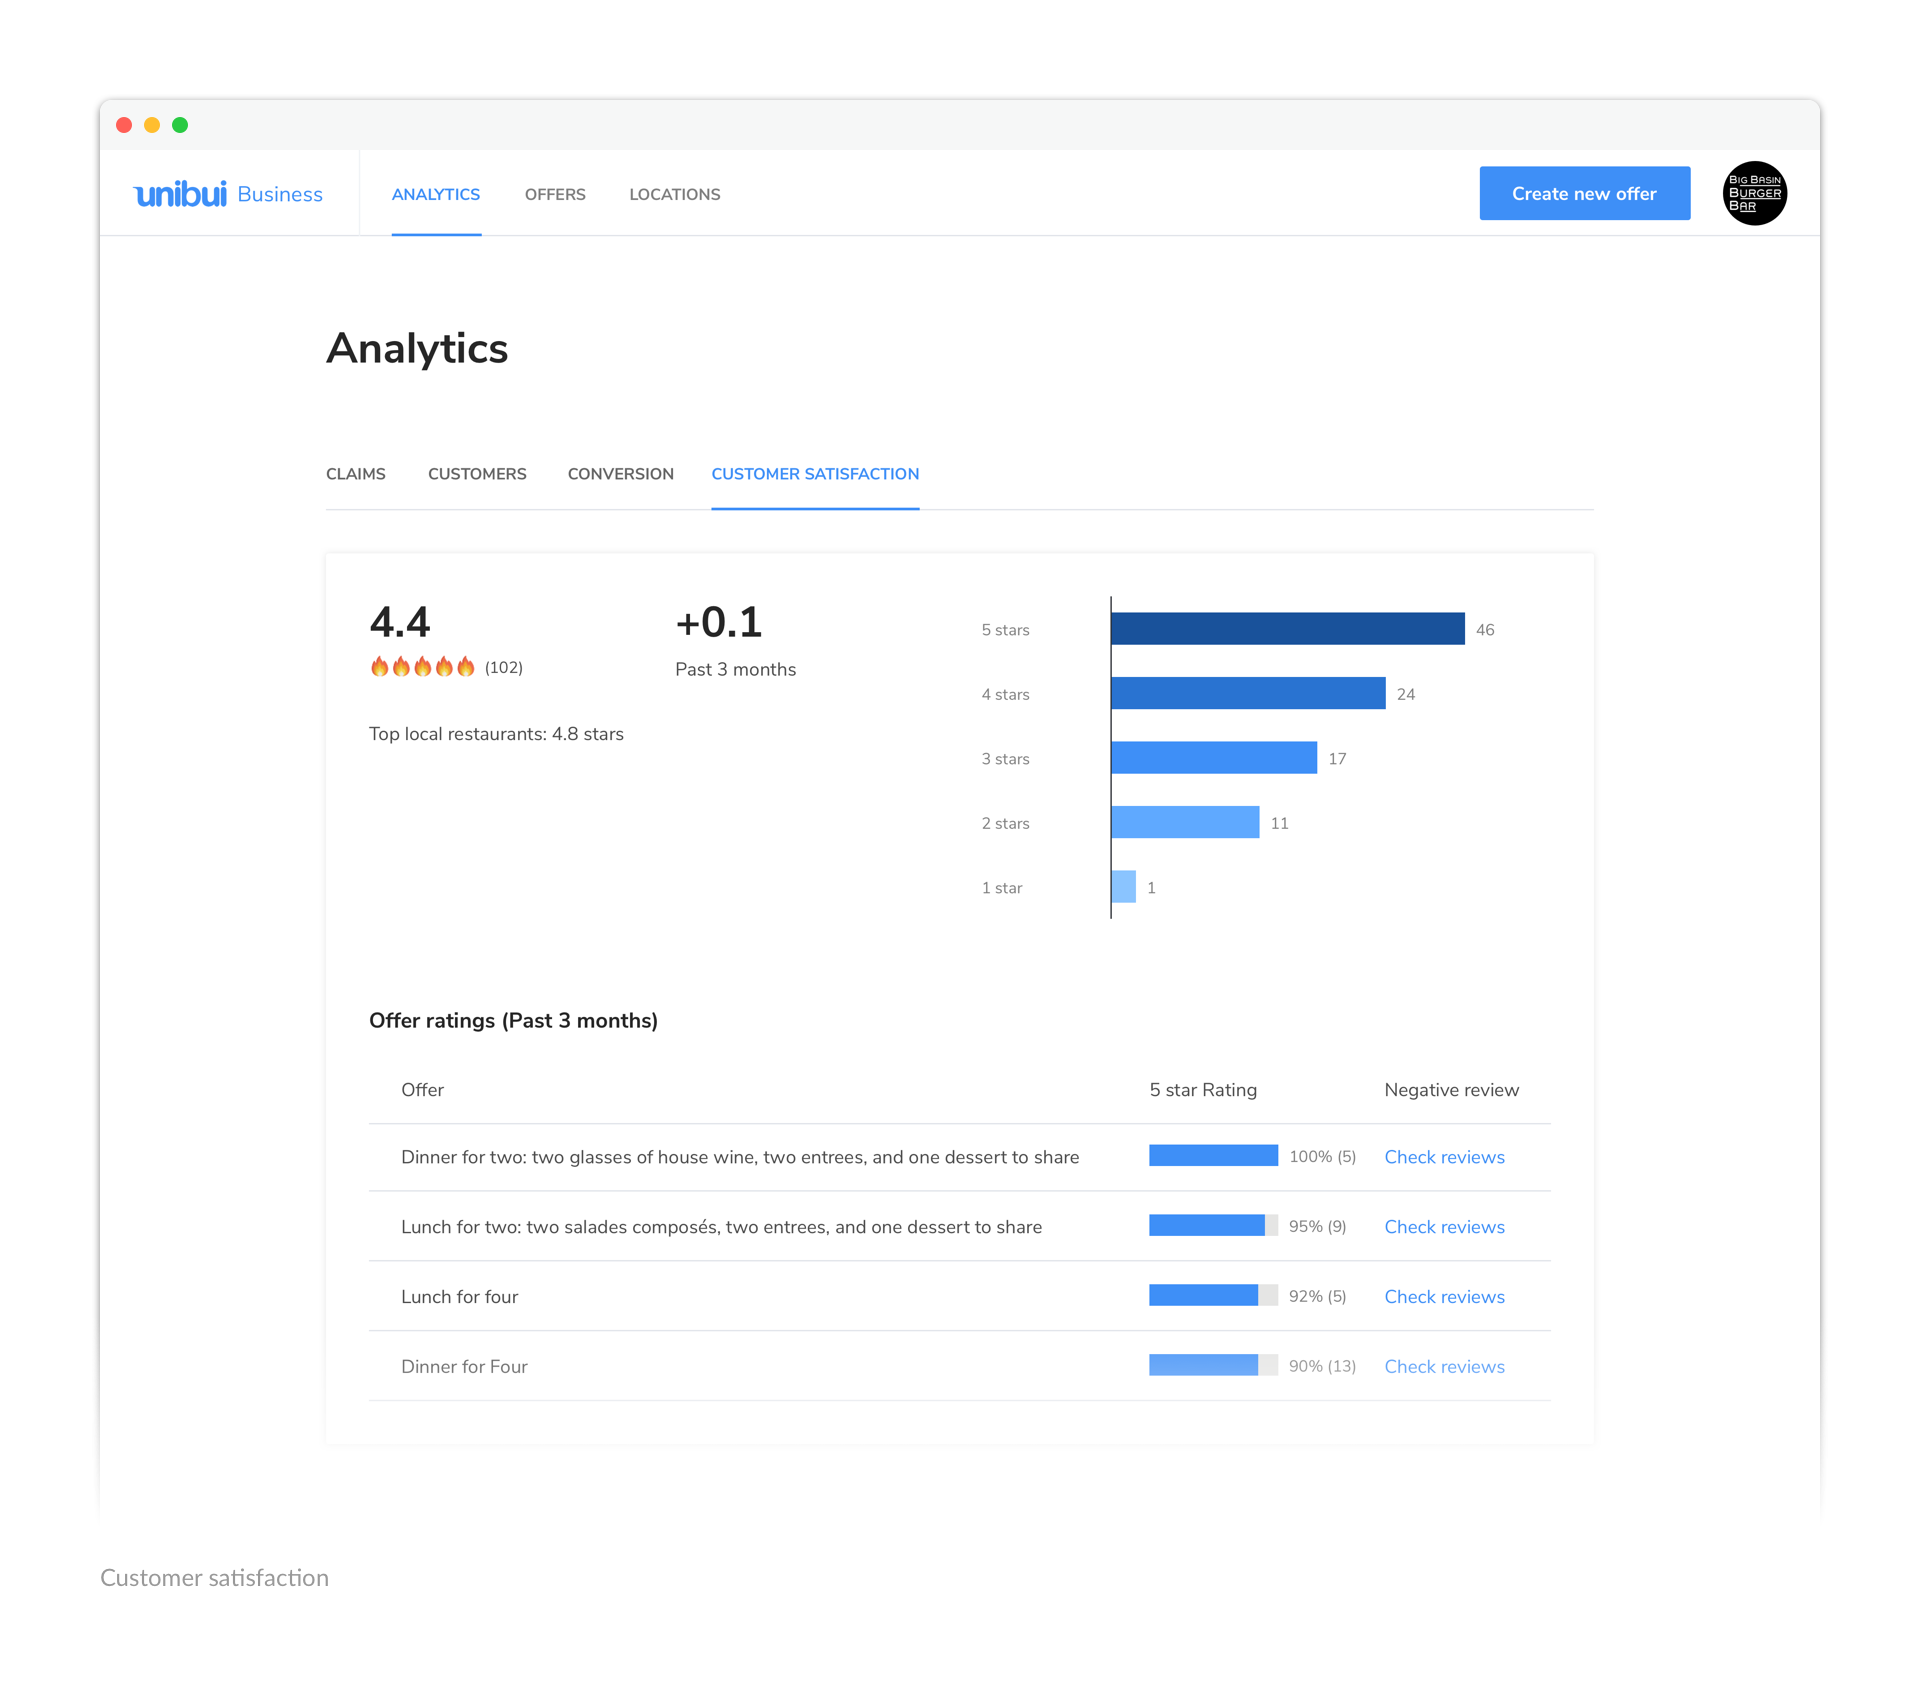
And finally, with our Customer Satisfaction section, we provide insights into the satisfaction of their customers. To measure this, we aggregate offer ratings and categorical feedback, among other metrics. By taking the pulse of customer satisfaction, businesses can make great improvements on their offers.
Browse the following gallery to see screenshots of all four sections of the Analytics dashboard:
Selected Works

LENOVO MOBILE APPProject type
UNIBUI MOBILE APPProject type

UNIBUI ANALYTICSProject type

UNIBUI BUSINESSProject type

UNIBUIProject type

COLGATE INNOVATION PORTALProject type